

Global pause, plateau or cooling – or, if you are reading the political climate narrative in mainstream media, are we heading for almost immediate climate Thermogeddon? Earlier this year, we published a graph showing satellite temperature measurements since the start of the latest pause up to March 2022. It indicated a global cooling trend of 0.14°C a century. Another five months on and the near eight-year pause continues, as does the almost unchanged cooling trend. Since the high point back in 1998, global warming has run out of steam. A pause from that date to about 2012 has now been followed by the latest eight year hiatus, with just a two-year period of mild warming in between.
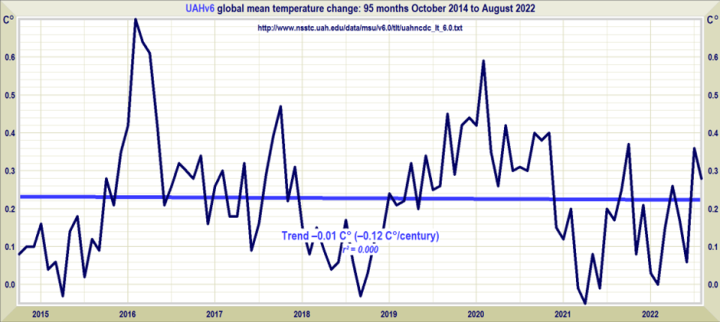
Not a lot of cooling, it might reasonably be noted, and we are still operating within a fair margin of error. But measuring climate change is about trends, not making fanciful, one-off claims that human activity causes Pakistan’s flooding during the monsoon season or causes summer heatwaves. The current temperature trend could be heading downwards, and if it continues the scientific arguments for Net Zero simply disappear. That of course is why you will never see the above graph in the mainstream media.
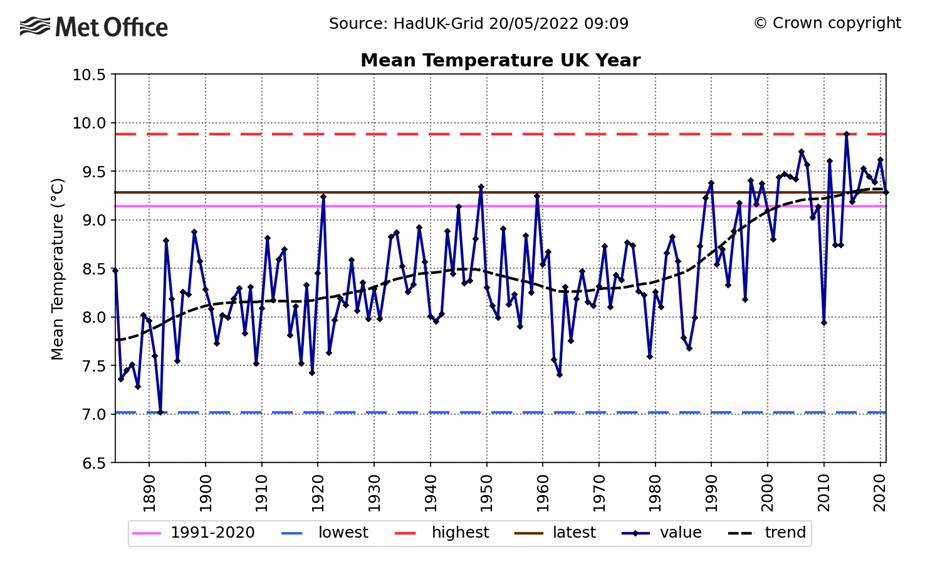
You probably will not see the above one either, even though it’s compiled from Met Office figures. This graph plots the average temperature of the U.K. going back to 1880. The temperature trend is not dissimilar to most territories within the populated northern hemisphere. There has been a little warming over the last two decades, mainly around a very strong El Niño natural oscillation in 2015-16. But the curve is clearly flattening. In fact, according to Met Office figures, the 2010s were actually colder in the U.K. than the 2000s. In the past, the average temperature rose by about 0.4°C from 1910 to 1945, fell after that date by about 0.25°C to 1970, and then showed a rise over the next 30 years of around 0.7°C. The slowdown set in around the start of the millennium. Throughout these periods, carbon dioxide continued to rise in the atmosphere.
Is it possible from data and trends such as this to reasonably conclude that humans control the climate and are causing untold damage? Damage, of course, that can only be remedied by imposing a command-and-control Net Zero agenda? One looks in vain in the recent temperature record for any obvious link between rising or falling numbers and higher CO2 emissions. Similar disappointment is to be found when attempts are made throughout most of the historical and paleoclimatic record.
Before he died, the Earth Sciences Professor Bob Carter said it was remarkable that given the expenditure of time and effort since 1990, no summed human effect on the climate had ever been identified or measured. “Therefore the human signal most probably lies buried in the variability and noise of the natural climate system,” he said. The Daily Sceptic has published extensively on past climate changes, showing periods when abrupt movements occurred over very short time periods. Professor Carter notes that compared with the ancient climate record, “temperatures during the last 20th Century were neither particularly high nor particularly fast-changing”. The warming within the 20th Century fell “well within” the natural rates of Holocene warming, as shown by high quality ice core records, according to Carter. A warmer or cooler planet than today’s is far from unusual: “Nature recognises nothing ‘ideal’ about mid-20th Century temperatures,” he added.
It is difficult to promote a climate scare with plateauing temperatures, so most of the effort has been switched to catastrophising natural disasters and single event ‘extreme’ weather events. But much of the narrative is fuelled by the often adjusted and modelled surface datasets that show higher recent warming than those produced by the satellites. Since 2013, the Met Office has made two adjustments to its HadCRUT global dataset, adding 30% more warming to recent temperatures. The 1998-2012 pause is no longer visible in the latest HadCRUT5, despite the Met Office writing about it in 2013. In his essay, Professor Carter drew attention to the measurable effect humans have on local climate caused by building towns and cities that absorb radiant heat from the Sun. The local warming is known as the urban heat effect and it is evident in many of the rising temperatures reported by surface datasets.
It came to light recently that a specialist dataset, designed to remove all urban heat distortions, has been compiled by the American weather service NOAA. The U.S. Climate Reference Network (USCRN) shows little evidence of a warming trend between 2005 and May 2022. When NOAA set up the 114 station project in 2005, it noted that it was aiming for “superior accuracy and continuity in places that land use will not likely impact during the next five decades”. Perhaps unsurprisingly, NOAA never mentions USCRN in any of its monthly or yearly public climate reports these days.
Of course, a surface dataset that has been given a little extra warming, and is corrupted by the urban heat effect, can continue to be used to proclaim continuing record temperatures. This feeds into what seem like increasingly desperate attempts to convince people that climate modelled claims of a 3-4°C rise by the end of the century is likely, absent Net Zero. The recent warm summer over large parts of Europe was of course mana from heaven for the climate alarmists. It was undoubtedly hot and records might have been broken. But just how hot was it in recent historical terms? There was a high temperature of over 40°C recorded at RAF Coningsby, set yards from the runways used by a squadron of after-burning Typhoon fighter jets. And it was replicated at Heathrow, another airport, as well as at a weather station just yards from one of the largest tropical greenhouses in the world at Kew.
But individual temperatures, however high or low, are not evidence of long-term changes in the climate. Paul Homewood has compiled this graph from the longest continuous temperature record in the world – the Central England Temperature Series.
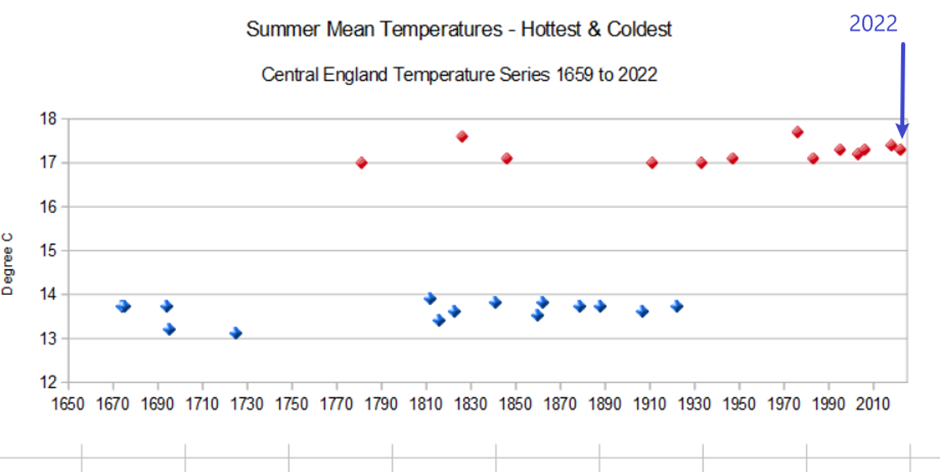
According to Homewood’s reckoning, it was much hotter in 1976 than 2022. Indeed it was hotter in 1826 and 2018, and this summer was no hotter than 1995 and 2006.
If we look back in the paleoclimatic record we would be bound to find countless summers that were hotter than 2022. Something to consider when you next see ‘ever’ tacked onto a media report promoting another climate scare.
Chris Morrison is the Daily Sceptic’s Environment Editor.